
 Here’s a lesson I designed for use in my University of Alaska Southeast summer course – ALST 600. I’ll be working with nearly 40 preservice teachers in the secondary MAT program teaching Alaska Studies using a place-based approach that integrates good instructional practice and free ed tech tools across the curriculum. For more on this lesson click here
This lesson features a poem as a prompt for a creative reflection. It also integrates two tools for presentation of the reflection.
- After reading Where I’m From, students will use Haiku Deck to design a brief presentation that uses text and images to depict “where they are from.” The presentation should include a a title slide plus 6 slides which explore the place you’re from. Follow this link for ideas on Where to Go with “Where I’m From”
- After completing the Haiku Deck presentation, students will create a blog post that includes an embedded version of the presentation and a written response to the question:
What have I learned from this activity and how might I use the learning strategies and / or technology in my teaching placement?
“Where I’m From” by George Ella Lyon
I am from clothespins,
from Clorox and carbon-tetrachloride.
I am from the dirt under the back porch.
(Black, glistening,
it tasted like beets.)
I am from the forsythia bush
the Dutch elm
whose long-gone limbs I remember
as if they were my own.
I’m from fudge and eyeglasses,
from Imogene and Alafair.
I’m from the know-it-alls
and the pass-it-ons,
from Perk up! and Pipe down!
I’m from He restoreth my soul
with a cottonball lamb
and ten verses I can say myself.
I’m from Artemus and Billie’s Branch,
fried corn and strong coffee.
From the finger my grandfather lost
to the auger,
the eye my father shut to keep his sight.
Under my bed was a dress box
spilling old pictures,
a sift of lost faces
to drift beneath my dreams.
I am from those moments–
snapped before I budded —
leaf-fall from the family tree.


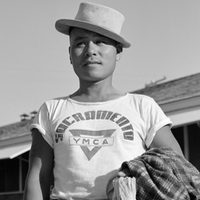

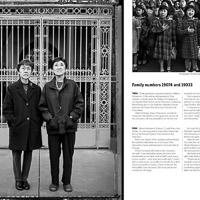
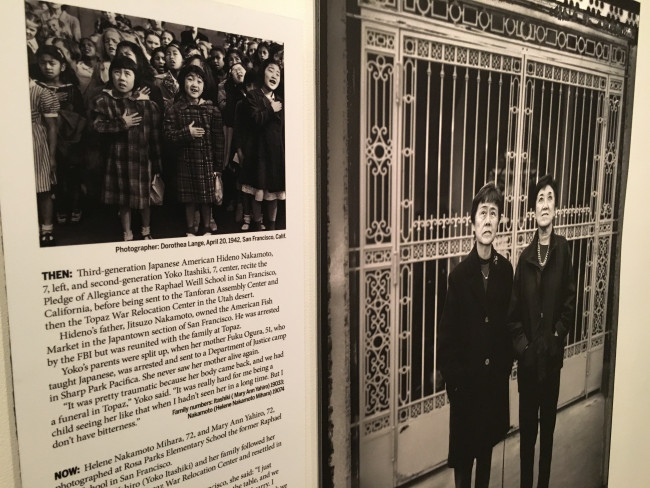 Pledge of Allegiance: Hideno Nakamoto and Yoko Itashiki at age 7 and at 72
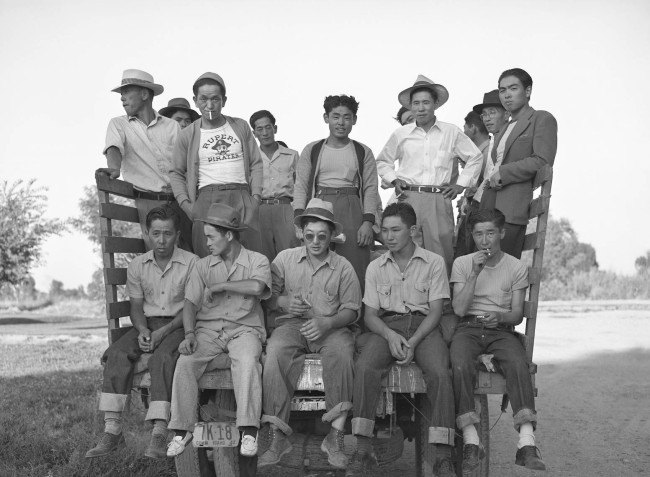
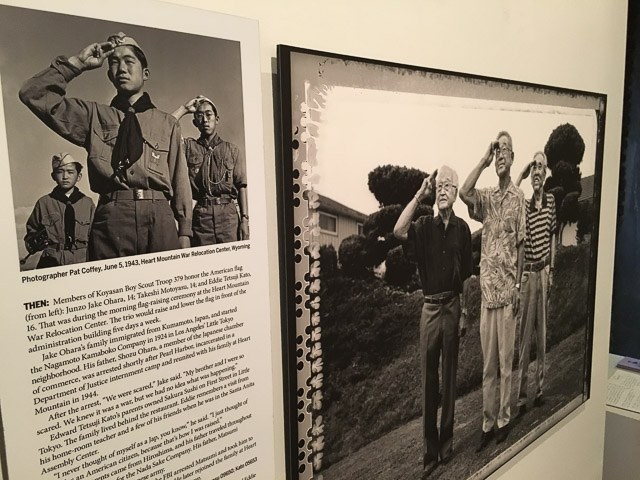 Incarcerated at Heart Mountain: Three Boy Scouts Honor the American Flag (1943 and today)